The Real Meaning of WOTUS

The Real Meaning of WOTUS

Last week at the Iowa Water Conference, I attended several sessions that illustrated of the consequences of paving over wetlands and streams.

This week, the Supreme Court is revisiting the question of which wetlands and streams are subject to the jurisdiction of federal agencies–another chapter in the Waters of the United States (WOTUS) controversy. The importance of this legal back and forth for agriculture and water quality has been greatly exaggerated. In practice, the definitions haven’t changed much and it mostly concerns Section 404 of the Clean Water Act: if your construction project involves running a bulldozer or backhoe in a stream or wetland, do you need to get a permit from the US Army Corps of Engineers?

Prairie Rivers of Iowa generally avoids getting mixed up in politics and policy, but maybe I can shed some light on what’s at stake and what isn’t.  Last week I was at the Iowa Water Conference with colleagues from Story County and the City of Ames to give a presentation on our locally-led water monitoring program. While at the conference, I attended several sessions that illustrated of the consequences of paving over wetlands and streams. Shout out to Michael Jansen of Strand Associates, Steve Brown from the City of Dubuque, and Tim Olson and Ryan Benjederdes of Bolton & Menck for sharing their projects.

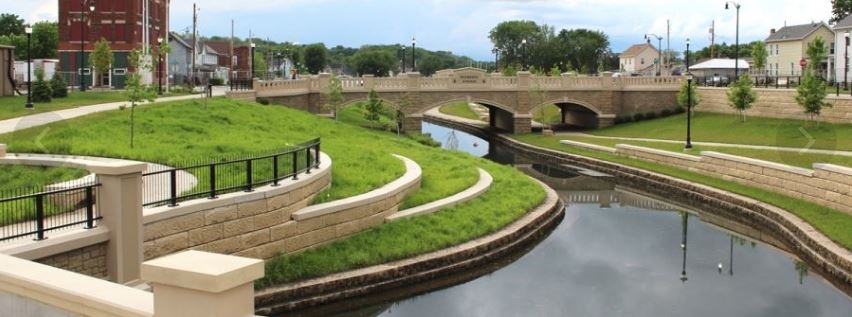
In Dubuque, a creek called Bee Branch had been put into a pipe to build a business district and a residential neighborhood, but had the habit of backing up into the streets and basements whenever the Mississippi River was high and there was a summer downpour. What used to be the 100 year storm is now the 50 year storm, so the complaints from residents were getting louder and more frequent. The solution was to daylight the creek and turn it into an amenity. The Bee Branch Greenway is beautiful and very thoughtfully designed, but it took a decade to build and cost $250 million.

In a Minneapolis suburb, a wetland complex had been paved over for commercial development prior to the passage of the Clean Water Act. The water the wetlands used to store was regularly backing up into the streets: a 4 inch rain caused 3 feet of flooding). A new transit line opened up some redevelopment opportunities, but the water the wetlands used to store had to go somewhere, so they put it in massive underground chambers. The project included a lot of clever engineering to detain and treat the water within a limited footprint, and a lot of innovative construction to get it installed while keeping the restaurants and stores open, but it came at a cost of $10 million.

A highlight of the conference was seeing Tracy Peterson (who’s helped us with many watershed projects and events) get an award. As an engineer for the City of Ames, Tracy regularly deals with the consequences of past development on rivers in the City of Ames, overseeing projects to reduce flooding on South Duff, clean up runoff on Welch Ave, and control erosion on the South Skunk River and Ioway Creek.

Bottom line, when developers are allowed to pave over wetlands and streams without limit and without mitigation, we pay for it later with flooded basements or big infrastructure projects. There’s a debate to be had over what level of government has the authority to regulate construction in wetlands and waterways and how we should balance the competing interests, but that’s not the debate we’ve had.  For a decade, some politicians and interest groups have been claiming that an expanded definition of WOTUS is a threat to farmers. I don’t get it.

stormwater project in Bloomington, MN

In a previous job, I had the pleasure of reading boxes of old permit files and learning about what kinds of activities require a federal dredge/fill permit or state water quality certification.  As I recall, farming activities are exempt except for cranberry bogs (this was Wisconsin) and some new drainage ditches.  Best I can tell, this issue isn’t really about farmers, it’s about developers. It’s not really about water quality, it’s about flash flooding. It’s not really about the EPA, it’s about the US Army Corps of Engineers. It’s not just about federal overreach, it’s also about state under-reach.

This election season, remember the true meaning of WOTUS.  wink

Six Tips to Enjoy Iowa Lakes

Six Tips to Enjoy Iowa Lakes

lake at sunset

There is no better way to relieve stress and get an attitude adjustment than sitting by a lake, or floating on a lake. While the kids are going back to school, the lake season is by no means over. If you live near a lake, there will still be some evenings and weekends warm enough to enjoy swimming and paddling, and of course, it’s never too cold for fishing! But it’s hard to enjoy a lake if it’s choked with blue-green algae. Cleaning up Iowa lakes so we can enjoy will require some shifts to our attitudes.

1. Don’t Panic

I’m sure you’ve all heard about the “brain-eating amoeba” Naegleria fowleri. Iowa and Nebraska both had their first cases this year (both fatal), contracted at the Lake of the Three Fires and the Elkhorn River, respectively. While scary, it’s also extremely rare. Nationwide there have only been 154 cases in the past 60 years, concentrated in the South. And even where the amoeba is known to be present, there are ways to enjoy the water while minimizing risk.

2. Check Where the Beaches are Cleanest

Iowa Environmental Council maintains a map and puts out a weekly report showing where there are beach advisories. The map also shows many lakes with no advisories (the blue umbrellas). For example, in Story County, the beach house at Hickory Grove Lake has sometimes been closed this summer due to high E. coli levels, but at Peterson Park, E. coli has been consistently below the detection limit. Not every lake in Iowa is hopelessly polluted, and even the most troubled lakes will have their good days.  Take advantage of them!

map of beach advisories
Peterson Park Lake
The beach at Peterson Park is Story County looked inviting today, and we have some hot weather in the forecast.

3. Help clean up dirty lakes at the local level

Having spent some time enjoying a clean lake, hopefully, you are in a better frame of mind to tackle the not-so-clean lakes. There are lake improvement efforts all over the state that need the support of taxpayers or the help of landowners in the watershed. For example, Story County is planning a complete renovation of McFarland Park Lake, which recently suffered an algae bloom and fish kill.

“The renovation will: remove sediment, stabilize shoreline, increase lake depth, and improve lake habitat for aquatic plants and animals. Work will increase overall health of the lake, reduce the number of fish die offs in the future, and improve recreational opportunities.”

4. Keep clean lakes clean at the state and national level

It does no good to dredge out a lake if farmers in the watershed are going to plow up the hillsides around it. This is what happened to Lake of the Three Fires, as related by Chris Jones.  When a third of the county was converted from pasture to corn ground, the lake gradually returned to its former shade of brown. We can’t do much about naturally occurring amoebas, but we can take a hard look at the policies, business and purchasing decisions, and attitudes that shape farming practices across Iowa.

5. Think globally, act locally

The warmer the water, the more cases of Naegleria fowleri. The same goes for harmful algae blooms, a much more common problem in Iowa that is getting even more common. If we don’t reduce our greenhouse gas emissions fast, hotter temperatures and more intense spring rainstorms will continue to worsen our water quality woes. Fortunately, there are opportunities to reduce greenhouse gas emissions in Iowa while at the same time improving water quality in the short term by planting more deep-rooted perennials and cover crops, building up organic matter in the soil, and using less nitrogen fertilizer.

6. Share your favorite water memories

A friend was visiting from out-of-state this week. A family vacation to Iowa of course included time with the grandparents and a visit to the Iowa State Fair, but he also set aside time to take his kids wading in Ioway Creek, where they caught minnows and marveled at the weirdness of dragonfly nymphs. For my friend, time spent outdoors in creeks and lakes was an essential part of growing up in Iowa, and he wanted his children to share that experience.

What a wonderful mindset to cultivate as we work to improve water quality!

The Community Academy explores Ioway Creek
Peeling the Onion

Peeling the Onion

We know that weather influences water quality in Iowa’s rivers.  Last year, there was a drought and nitrate was lower than usual.  This spring, it’s been wetter and nitrate is higher than usual.  If you monitor for 10 years and the first 5 are a little wetter or drier than the last five, you’ll a water quality trend to go with it.  Boring! 

What we really want to know is how people are influencing water quality.  We can get a lot closer to that answer by peeling away the obvious weather-related patterns to reveal underlying trends.

In statistics, it’s called a covariate or an explanatory variable.  If there’s a relationship between your water quality metric and some other thing you’re not really interested in (i.e. streamflow), you can model that relationship to account for part of a water quality trend over time.  What’s left over might be the things you’re really interested in (i.e. how water quality has been affected by changes in crop rotations, conservation practices, sewage treatment, manure management, and drainage).  It’s common enough in the scientific literature (Robert Hirsch’s Weighted Regression on Time, Discharge, and Season is a good example), but should be used more often for progress tracking at the watershed scale. 

To illustrate this general approach, I downloaded daily nitrate data from three stations maintained by the US Geologic Survey.  The sensors at the Turkey River at Garber and the Cedar River near Palo (north of Cedar Rapids) were installed in late 2012; the sensor Raccoon River near Jefferson was installed in 2008.  I wanted a high frequency dataset (to minimize sampling error) that included the episodes of “weather whiplash” in 2013 and 2022.

nitrate trend in the cedar river

“Residuals” are the difference between what we predict and what we measured.  In the first panel, that’s the difference between a measurement and the long-term average.  In the second and third panels, we see how nitrate measurements differ from what we’d expect given flow in the stream today, and flow in the stream last year.  Gray dots – daily measurements.  Red dots- yearly averages.  Blue dotted line – trend.  If I did this right, some of the dots should get closer to the middle.

Nitrate concentrations in rivers increase as the weather gets wetter and streamflow increases… up to a point.  When rivers are running very high, there’s a dilution effect and nitrate concentrations fall.  Based on that relationship, we can explain high nitrate levels in the Cedar River in 2016 (a wet year) and low nitrate levels in 2021 (a dry year).

nitrate vs flow in the Cedar River

Nitrate concentrations tends to be highest on wet spring days following a dry summer and fall, as nitrate that accumulated in the soil during the drought is flushed into drainage systems or washed off the land surface and into rivers.  Here I’ve calculated a moving average of flow over the previous 365 days, and compared that to nitrate concentrations during high flow or low flow conditions.  Based on that relationship, we can explain high nitrate in the Cedar River on wet days in the spring of 2013 and 2022 (following a dry year) and low nitrate on wet days in the spring of 2019 (following a wet year).

relationship between nitrate and last year's flow

After making these adjustments, the downward trend in the Cedar River looks much smaller (0.53 mg/L per year, adjusted to 0.25) and is overtaken by the Turkey River (0.37 mg/L, adjusted to 0.28).  The adjusted trends are statistically significant and could be attributed to conservation efforts in those watersheds.

How did I do this?  For technical details, read here.

nitrate trend in the cedar river

However, there’s still some weather-related patterns we haven’t accounted for.  The Raccoon River near Jefferson also had a steep decline in nitrate since 2013 (1.42 mg/L per year, adjusted to 0.77 mg/L per year) but if you look at the entire record (going back to 2008), it’s part of an up-and-down cycle.  I’ve seen that same pattern in the South Skunk River.  The model explains some of those swings but doesn’t fully explain high nitrate in fall of 2014, spring of 2015 and spring of 2016.  Perhaps the nitrogen that accumulated in the soil during the drought of 2012 took several years to flush out.

In addition to streamflow and last year’s weather (antecedent moisture is the technical term), nitrate can be explained by season, soybean acreage, and baseflow.  If it’s not enough to know that water quality is improving or getting worse, and you’d also like to know why, then let’s peel that onion!

The Making of “Peeling the Onion”

How did I do this analysis for “Peeling the Onion“?

Easy peasy!

1.  I plotted nitrate against log-transformed streamflow and realized that the linear regression I tried a couple years ago doesn’t actually work because the relationship is non-linear, even after log-transforming the data.  The high R-squared and significant p-values were leading me astray because the data is skewed, auto-correlated, and heteroskedastic, violating all the assumptions of the statistical model!

2.   I consulted Chapter 12 of Statistical Methods in Water Resources, which recommended fitting a loess smooth to the explanatory variable (discharge) and running a Mann-Kendall test on the residuals.  In the presence of skewed data, Theil-Sen robust line works better than an OLS best fit line.  Step 1, figure out what that means.  Step 2, figure out how to do it.

3. But first, I plotted the residuals against a moving average of flow in the last 365 days to account for antecedent moisture conditions.  Here I went with a linear regression, but got a poor fit until I realized I needed to include an interaction term in the model.  There’s no relationship between antecedent moisture and flow-adjusted nitrate concentrations when there’s not enough water to flush nitrate out of the soil.  Silly me!

a screen shot of R Studio

4.  I tried to correct for seasonal differences in nitrate concentrations, but realized it didn’t explain much unless you make it really complicated.  The difference between spring (Apr-Jun) and summer  (Jul-Sep) is already explained by lower flow in summer.  The difference between summer and fall (Oct-Dec) is a difference in the shape of the nitrate-flow relationship.  During low flows, nitrate will be higher in fall than summer because of denitrification in the stream.

5.  I spent a long time debugging code to make that three pane graph with model coefficients.

Okay, that was really hard.  I would never have done that if I’d known what I was getting myself into!  However, now that the code is written, it’ll be relatively easy to redo this analysis for other streams in Iowa.

The Best Nitrogen Analogy Ever

The Best Nitrogen Analogy Ever

Imagine the nitrogen cycle is a trust fund kid with a gambling problem.

 The young man (a corn field) is very rich (has rich black soil) but the money (nitrogen) he inherited from his father (the prairie) is locked in a trust fund (soil organic matter). Only a small portion of the funds are released to him each year (mineralized) following a complicated schedule determined by the trustees (microbes in the soil). In order to maintain the lifestyle to which he has become accustomed (provide enough nitrogen to the crop for good yields), he needs supplemental income (nitrogen from commercial fertilizer or manure). His sister (a soybean field) does not need to work (apply fertilizer) because she can borrow money from her well-connected husband (symbiotic nitrogen-fixing bacteria) but she also receives payments from the trust (mineralization).  She helps her brother out (corn needs less nitrogen fertilizer following soybeans) but not directly (soybeans actually use more nitrogen than they fix, so the benefits of the rotation has more to do with the behavior of the residue and disrupting corn pests).

A Richie Rich cartoon, but with nitrogen

Both siblings have a gambling (water quality) problem and are terrible poker players. Whenever they’re feeling flush with cash (when other forms of nitrogen have been converted to nitrate) they blow some of it playing cards (nitrate easily leaches out of the root zone when it rains), but the extent of the losses vary and debts aren’t always collected right away (nitrate leached out of the root zone may not immediately reach streams). They struggle with temptation more than their cousins (alfalfa and small grains) because they come from a broken home (the soil is fallow for large parts of the year) and because bills and income don’t arrive at the same time (there is a mismatch between the timing of maximum nitrogen and water availability and crop nitrogen and water use).

“”Okay, Dan, that’s very clever, but what’s your point?

Well, having compared the soil to a trust fund, I can now say “don’t confuse net worth with income.” You’ve probably heard that there 10,000 pounds per acre of nitrogen stored in a rich Iowa soil. That’s true but misleading. The amount actually released each year by decomposing organic matter (net mineralization) is only a few percent of that, comparable in size and importance to fertilizer or manure.  Here’s an example nitrogen budget.

Example nitrogen budget, for Tipton Creek in Hamilton & Hardin Counties

On average and over the long-term, we know that fields and watersheds with higher nitrogen applications (taking into account both manure and commercial fertilizer) leach more nitrate into the water. On average and over the long-term, we know that that farmers can profit by reducing their application rate to the Maximum Return To Nitrogen (the point at which another pound of nitrogen does not produce a big enough yield bump to offset the fertilizer costs).  Right now, with corn prices high but fertilizer prices going nuts, the MRTN is 136 pounds per acre for corn following soybeans, while in the most recent survey I could find, farmers reported applying an average of 172 pounds per acre.  So there’s room to save money while improving water quality!

But having compared nitrate leaching to gambling, I can also say “don’t confuse a balance sheet problem with a cash flow problem.”  In any given year, it’s always a gamble how much of the nitrogen that’s applied will be washed away and how much will be available to the crop.  Maybe some farmers are passing up on an opportunity to increase their profits because they’re not comfortable with the short-term risks.

Figure from John Sawyer
current MRTN

 Farmers say that extra nitrogen is cheap insurance.  If that’s true, maybe we need crop insurance that makes it easier to do the right thing, not a more precise calculator.