Edited 2020-10-16 to clarify a few sections, add references as links, and correct statements about trends. It has gotten worse
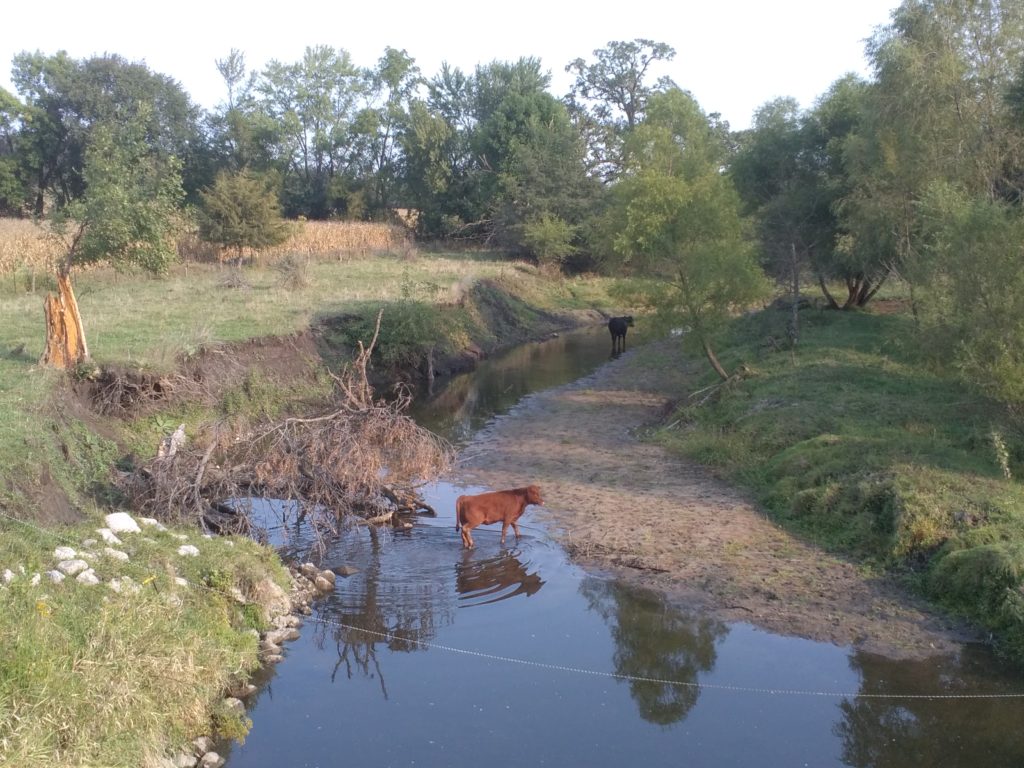
People swim, paddle, and wade in Iowa lakes and rivers. I’ve seen a lot of that this summer. We’d like those waters to be clean enough that it doesn’t pose a health risk. But see enough E. coli data, and it’s tempting to give up. There’s raccoons in the storm sewers, and geese on the lakeshore, and livestock on the farms, so therefore there will be poop in the rivers and lakes. How on earth would you ever figure out where it’s coming from, let alone improve the situation? I’ve said this once or twice, and I’ve heard it from experts I’ve consulted.
So hat tip to Chris Jones for putting our numbers into context. I love context! Let me add some more! (Check out his blog post to for some excellent background on what this bacteria is, and why we measure it).
It’s bad, and don’t blame the geese
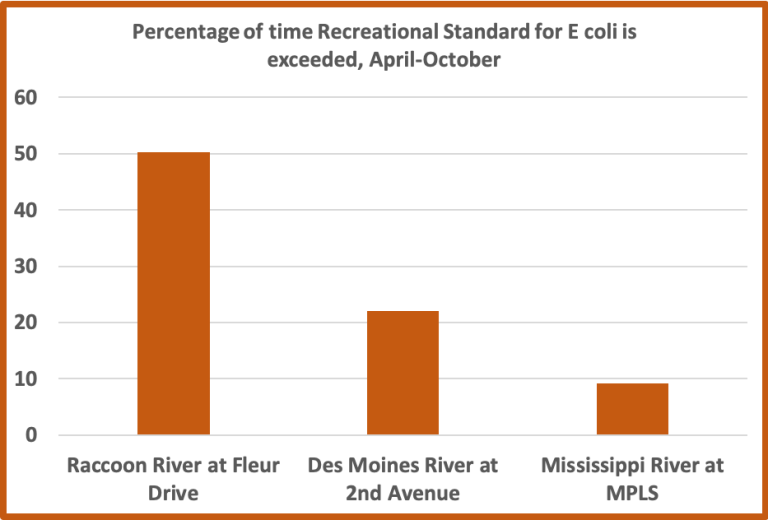
I was inspired by Chris’s graph, which compares E. coli in the Raccoon and Des Moines Rivers in Des Moines to the Mississippi River in Minneapolis. That river has plenty of geese and raccoons, as I can attest to from having lived in the Twin Cities. So clearly there’s some additional sources of fecal contamination in these Iowa waters that we could do something about, if we had the will.
It’s very bad some places, fine in others
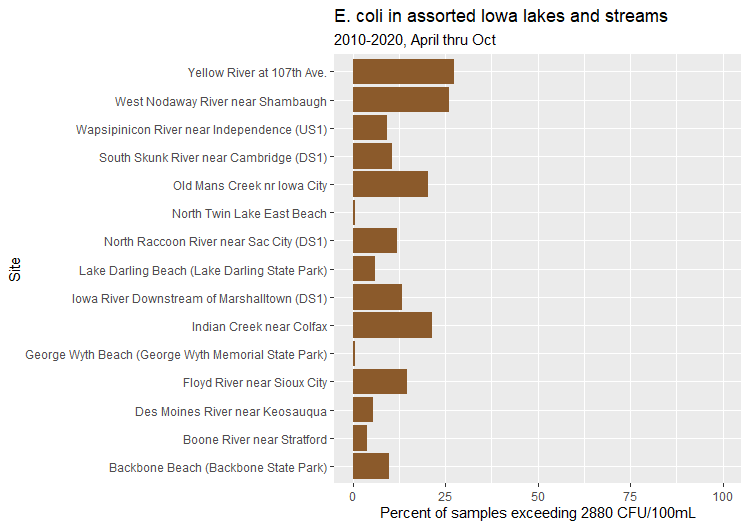
I love this metric: percent of days in the recreation season that E. coli exceeded the standard. Nobody knows what a geometric mean is, or how many samples you need before you can apply it. This is a simpler way of acknowledging that sometimes there will be poop in waters where people wade or swim (say because there are racoons in the storm sewers and it just rained) but we’d like that to be less often. Using my new powers of R scripting, I computed this metric for every water body in an Iowa DNR database that had at least 50 E. coli samples during April-Oct of 2010-2020, and when I couldn’t fit 160 bars on a graph, I pulled out an arbitrary selection to give you a sense of the range.
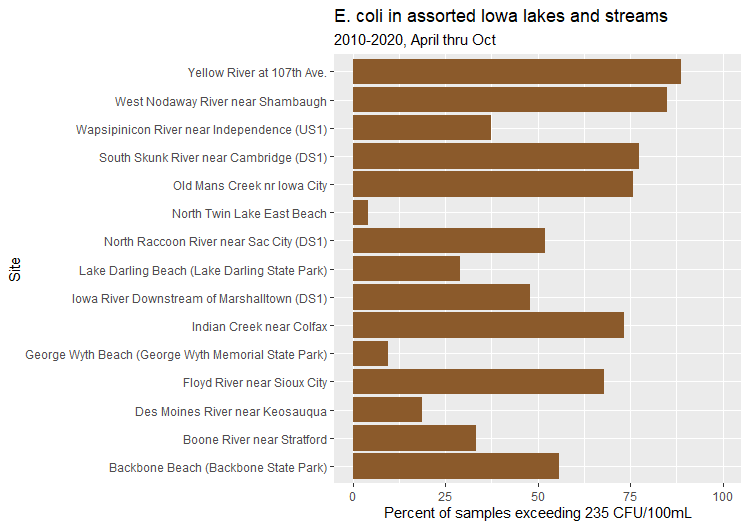
As I feared, the South Skunk River below Ames is even worse than the Racoon River, exceeding the standard 75% of the time, as are several rivers in central, western, and northeastern Iowa. As Chris mentioned, E. coli is lower downstream of reservoirs, which allow sediment to settle and light to disinfect. Some of the cleanest waters aren’t on here because DNR rarely finds anything, and thus has scaled back testing. This includes destination spots like Okoboji Lake, and my favorite local beach, the former gravel pit at Peterson Park, which is mostly groundwater fed.
It hasn’t gotten worse, has it?
I have fond childhood memories of wading and canoeing and fishing in Iowa rivers and lakes, including the South Skunk River. How bad was it then? I don’t know. I do have data from 2000-2004, when I was an ISU student hauling trash out of the river and planting willow stakes with Jim Colbert’s “Skunk River Navy.” At that time, the South Skunk upstream of Ames met (today’s) primary contact recreation standard, but started to exceed it in 2006. The South Skunk River downstream of Ames and below the confluence with Squaw Creek has exceeded the standard in every year it’s been measured, but was twice as high the last two years as it was in 2000-2004.
Here I’m using the geometric mean for April-October and the 126 CFU/100 mL standard that applies to it, since I already had that calculated. Apologies if you have trouble keeping track of the various standards.

The DNR was monitoring the South Skunk upstream of Ames at Riverside Drive for a special project, which ended in 2014. However, we’ve been monitoring that site and several others in Story County this year. So far, it’s higher there than it was in 2000-2004, barely meeting the standard, but I have one more month left in the “recreational season.” Every other site we monitored (that didn’t dry up this summer) was 2 to 9 times higher than the standard.

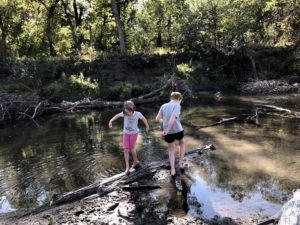
Confession: I am unwilling to give up playing in rivers or deny that experience to my kids because of a fecal bacteria problem that seems unlikely to be addressed. As a whitewater paddler, I’ve always been willing to take some risks to enjoy nature, and am not sure how the risk of waterborne illnesses compares to the more obvious risks of drowning and injury. I now make sure to pack hand sanitizer on river outings, and try to keep my head out of the water, but hey, sometimes your boat tips over and that’s part of the fun!
Can you keep your head above water?
Primary contact recreation uses “involve full body immersion… such as swimming and water skiing.” The same standard applies to smaller creeks “where children’s activities are common, like wading or playing in the water.” Small kids tend to splash and put their hands in their mouths. Water designated for secondary contact recreational uses, “such as fishing and shoreline activities” have a less stringent single sample E. coli criteria of 2,880 CFU/100mL. The South Skunk River exceeds the secondary contact standard less than 10% of the time, so if fishing is all you’re doing, you can worry less.
Wait, can I do that? Apply secondary contact criteria to a water body designated for primary use? The DNR doesn’t, even when it would make sense. Long Dick Creek is on the Impaired Waters List for E. coli levels above 235 but below 2,880. In reality, it’s too small to float a canoe and has no public access. If this decision affected anyone’s permit, someone would have asked for an assessment to rebut the presumptive designated use, but it doesn’t, so it will remain on the Impaired Waters List for the foreseeable future, last in line for a cleanup plan (TMDL). This underscores a frustrating truth about the Impaired Waters List and the broader Clean Water Act. It was set up to regulate point source polluters like wastewater treatment plants and industry. It’s not a very good framework for educating the public about risks, or for cleaning up waters affected by other (non-point) sources of pollution.
How risky is manure?
Which brings us to risk. Not only is it hard for most people to evaluate risks when they have the numbers, we don’t have numbers that are relevant for Iowa.
What does EPA mean by “protective of human health” when considering E. coli and contact recreation in a lake or stream, where immersion and ingestion of the water is likely? In this case, a threshold of 235 CFU/100ml (or a geometric mean of 126) would be expected to produce illness in no more than 36 people in 1000 (i.e. 3.6%). So meeting the standard does not equate to zero risk.
Chris Jones, “Dream On“
I’ll have to dig up the references, but as I recall, these risk calculations were based on epidemiological studies of GI infections at swimming beaches that were sometimes affected by human waste. Part of the debate in the scientific literature is whether those same rates risks apply when the source of E. coli is animal waste.
It’s a question of relatedness. Assuming there’s poop in the water and assuming you swallowed some water, and assuming the animal in question was sick, you’re less likely to contract an illness from poultry and geese manure than swine manure, which is less risky than cow manure, which is less risky than untreated human waste. On the other hand, here’s some research linking pathogens in central Iowa streams to swine manure.
Also, a single threshold is not that helpful for evaluating risks in the many waters that don’t meet the standard. If E. coli a stream is 10 times the standard, is my risk ten times as high? Probably not. Twice as high? The original EPA studies are no help here because not only is the risk model hard to interpret (I’ve tried), the numbers we have here in Iowa are well outside the range used to calibrate the model!
What are we gonna do about it?
As part of Story County’s 10-year Monitoring Plan, we’ve been monitoring E. coli in several local streams. Our partners at ISU, Story County, and City of Ames will be exploring the use of optical brighteners to track down wastewater discharge. We know there are some bad septic systems and aging sewer pipes contributing to high E. coli levels in the South Skunk River and Squaw Creek, and since those pose a higher health risk and are perhaps easier to address than livestock manure, that’s where we’ll start. But I’ve love it if we could talk about manure too, without it being seen as controversial.
I appreciate that Chris Jones brought up E. coli. Amid all the talk about nutrients, we often lose sight of another pollutant whose impact is easier to see locally.