November 2020
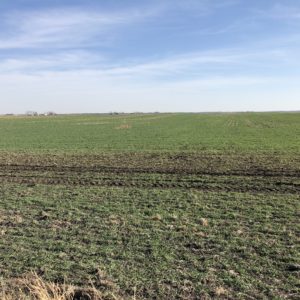
A big thank you to farmers who planted cover crops after this challenging year. Cover crops will hold soil and nutrients in place through the winter and early spring. That could be especially important this year.
After a drought, nitrogen that might normally have been taken up by a high-yielding crop or flushed away by rainfall remains in the soil. That leftover nitrogen could be available for next year’s crop, but only if:
A) we have a dry spring, or
B) farmers have made use of practices like cover crops or nitrification inhibitors that prevent nitrogen losses during the fallow season.
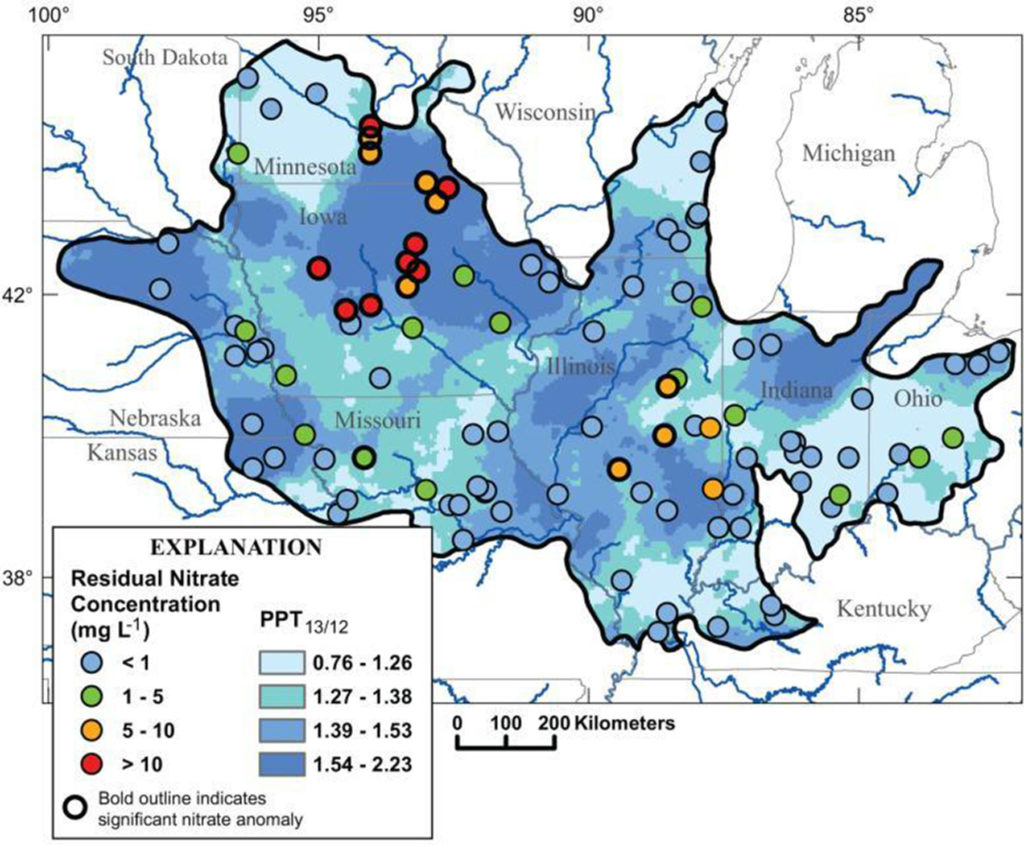
A drought in 2012 following by a wet spring in 2013 led to nitrate concentrations in excess of 20 mg/L in many rivers in Central Iowa. If we have a wet spring in 2021, we could see this happen again. As one scientific paper put it, “weather whiplash drives deterioration of water quality.”
“Weather whiplash” can also help explain the long-term trends I’ve been seeing in the South Skunk River and its tributaries: a decline in nitrate concentrations from 2005-2012, a big jump in 2013, and another decline over the past 7 years. I’ll walk you through my analysis.
Explaining nitrate concentrations in the South Skunk River
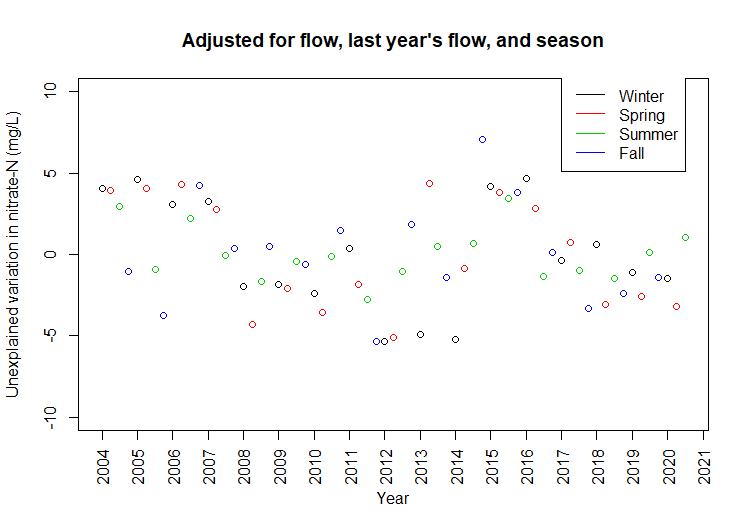
Technical details, feel free to skip: This data was collected by the City of Ames just upstream of wastewater treatment plant. The City has monitored the South Skunk River above and below its wastewater treatment plant almost every week since 2003! Flow is measured continuously at a few miles upstream USGS gage near S. 16th St. I’ve summarized nitrate concentrations and streamflow by season (Jan-Mar, Apr-Jun, Jul-Sep, Oct-Dec). At each step of the way, I apply a linear regression equation and graph the model residuals. Taken together, these three factors explain 59% of the variation. The effects of “weather whiplash” may extend beyond one year, since nitrate from some parts of the field may travel more slowly to streams via groundwater.
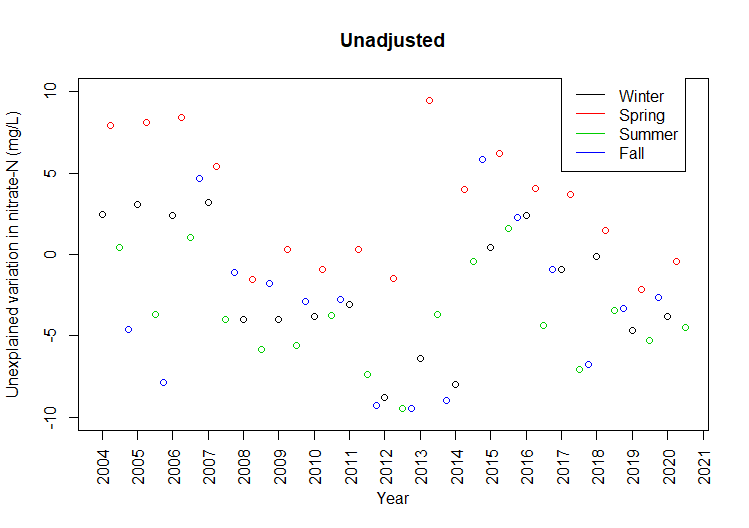
In a given quarter, nitrate concentrations in the South Skunk can be up to 10 mg/L higher than the long-term average, or as much as 10 mg/L lower. The following graphs show how much variation is left to explain after correcting for current weather, last year’s weather, and season.
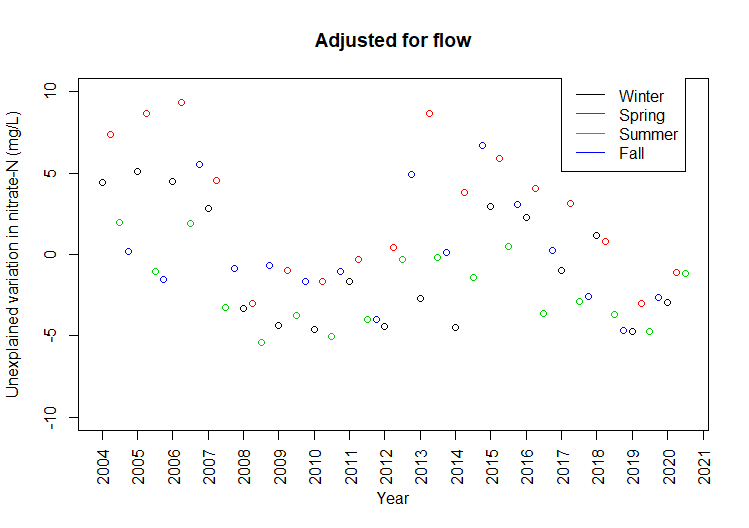

- The lowest nitrate concentrations can be explained by streamflow: when the weather is dry and tiles aren’t flowing, nitrate levels in rivers taper off to the background levels seen in groundwater.
- The highest nitrate concentrations can be explained by weather over the previous 12 months: a wet period following a dry period will flush out nitrate that’s accumulated in the soil.
- After that, there’s still a seasonal pattern independent of rainfall: nitrogen is most susceptible to loss in spring when soils are bare and microbial activity picks up (April-June) and least susceptible when the maturing crop is using up the available nitrogen (July-Sept).
- Can some of the remaining pattern be explained by greater adoption of conservation practices in the watershed in the past 5 years? We hope so, but let’s see what happens next spring!