Disclaimer: This article is not about politics. PRI is a non-partisan organization and does not want to get drawn into a discussion about the election. My intent here is to use an example that’s fresh in our minds to illustrate a challenge for progress tracking in water quality.
Polls are not always accurate. If you didn’t know that before November of 2020, you do now.
There are plenty of parallels with water, so if you’re looking to water quality monitoring to tell you whether or not conservation efforts in your watershed or your state are succeeding, read on.
Bottom line: Short-term water quality trends are usually too close to call.
Quinnipiac University can’t talk to every eligible voter in Florida, so they surveyed 1,657 people the week before the election.
Similarly, it’s not practical to test water quality in a stream 365 days a year, so we often make do with just 12 days a year. There are sensors that can test nitrate or turbidity continuously during the ice-free months, but they’re not cheap.
The voting patterns of those 1,657 people won’t be perfectly representative of Florida. How close do they expect to be? Based on the sample size, Quinnipiac calculates a margin of error: in this case 2.4 percentage points. Talking to more people would reduce the margin of error, but not enough to be worth the cost. In this case, Biden’s lead appears to be outside the margin of error.
| Support for candidate | Point estimate | 95% confidence interval |
|---|---|---|
| Biden | 47% | 44.6% to 49.4% |
| Trump | 42% | 39.6% to 44.4% |
Similarly, the 12 days we test water quality won’t be perfectly representative of the year. How close can we expect to be? We can calculate a margin of error (here, the 95% confidence interval) around our water quality average. Did phosphorus decline in 2019? Too close to call!
| Phosphorus in South Skunk River | Point estimate | 95% confidence interval |
|---|---|---|
| 2019 average | 0.30 mg/L | 0.20 mg/L to 0.40 mg/L |
| 2018 average | 0.36 mg/L | 0.26 mg/L to 0.46 mg/L |
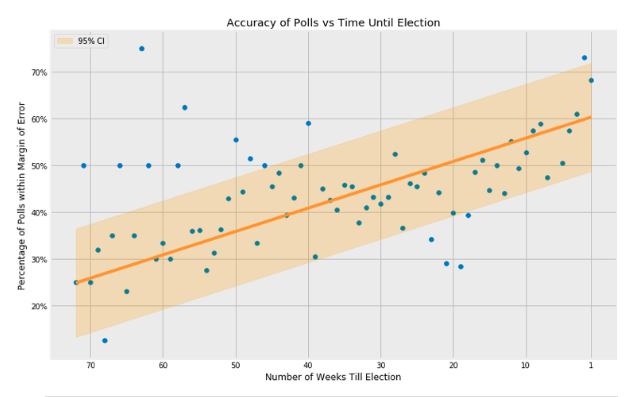
Oops! This poll missed the mark, and by more than the margin of error. Trump actually won Florida with 51.2 percent of the vote. Well, some errors are unavoidable. If sampling error were completely random, we’d expect about 5% of polls to miss by more than the margin of error. That’s what “95% confidence” means. However, according to a new study of 1,400 polls from presidential primaries and general elections, 40% of polls conducted a week before the election missed the mark by that much.
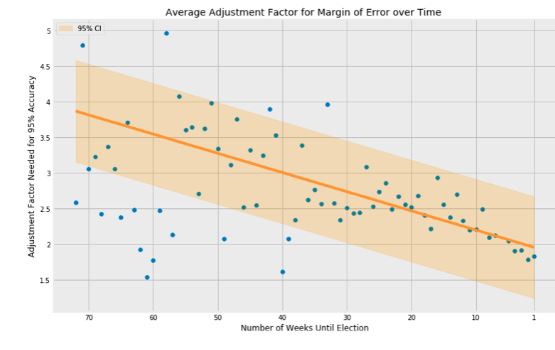
That’s because sampling error isn’t all random. People who ultimately voted one way may have been less likely to appear on the list of phone numbers, less willing to respond, less likely to say what they truly intended, or were more likely to have changed their mind in the final week. And then there’s undecided voters, who don’t always split evenly between candidates. Any of these things can skew the results. Pollsters try to correct for some of these things by weighting various demographic groups, but it doesn’t always work. For “margin of error” to mean what we think it means, according to Kotak and Moore, it would need to be at least two times wider.
Similarly, if monthly samples are not collected on a fixed day of the month, you might underestimate phosphorus or sediment load by planning your week to avoid getting wet, and over-estimate it by going out of your way to capture a sample during a storm. This challenge is well understood in environmental science and there are sampling strategies and equipment to get around it.
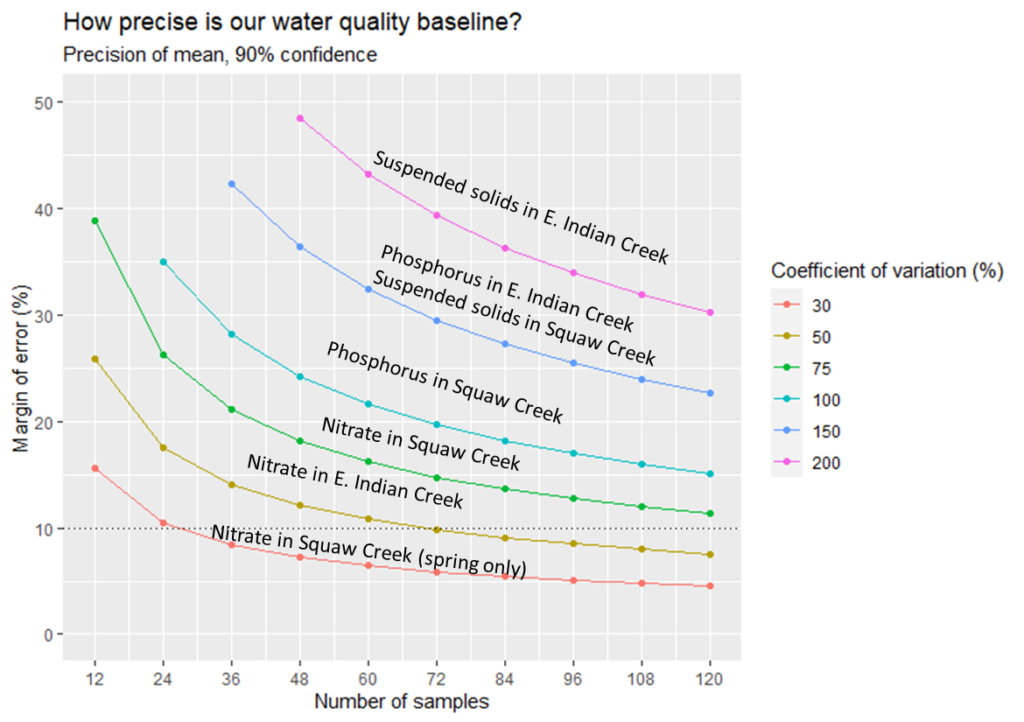
What’s not widely appreciated is just how big purely random sampling errors can be. I’ve read the literature and run my own numbers. Even with a 3 years of sampling, you’re lucky to get below a 20 percent margin of error. The problem is more severe for phosphorus and sediment (which move with runoff and vary a lot within a month) than nitrate (which moves with groundwater and drainage water, and is less variable).
Knowing this can help us set realistic expectations. As much as we’d like to know whether conservation efforts on the land are translating into improvements in water quality in the river, we’re not going to be able to tell the difference between a modest improvement and no improvement unless we sample often enough or long enough to bring down the margin of error. Figuring out whether this is worth doing, how to sustain it, and what other things we can learn from water monitoring has been the task of PRI and our partners around Story County working on a ten-year monitoring plan.
A final note. Have some sympathy for pollsters and scientists who are doing their best to base their findings on data, acknowledge the uncertainty in their conclusions, and strive to be less wrong. There are plenty of people on both sides of the aisle who confidently make predictions based on anecdotes, are wrong more often than not, and never admit it. 😉